eBPF summit 2023 CTF
The eBPF summit held a CTF, which you can download from here.
Here's a record of my attempts.#
vagrant up
vagrant ssh
Now what's in that file?
$ sudo cat /ebpf.summit
I've been in your kernel for [281.819050 seconds]
$ sudo cat /ebpf.summit
I've been in your kernel for [282.820065 seconds]
How is it updated so quickly? Are they constantly writing to that file?
$ ls -l /
total 72
lrwxrwxrwx   1 root    root        7 Aug 28 22:11 bin -> usr/bin
drwxr-xr-x   3 root    root     4096 Aug 28 22:12 boot
drwxr-xr-x  17 root    root     3840 Sep 13 16:25 dev
----------   1 root    root       50 Sep 13 16:30 ebpf.summit
drwxr-xr-x  91 root    root     4096 Sep 13 16:27 etc
What's ----------??
$ stat /ebpf.summit
  File: /ebpf.summit
  Size: 50          Blocks: 8          IO Block: 4096   regular file
Device: 801h/2049d  Inode: 73151       Links: 1
Access: (0000/----------)  Uid: (    0/    root)   Gid: (    0/    root)
Oh ok it's just the result of chmod ugo-rwx. A user can lock itself out of
their own file, but root still has access anyway.
So, are they really writing so frequently or is there some other kind of magic?
$ sudo lsof /ebpf.summit
$ ps aux | grep ebpf
Ok, this is an ebpf ctf, so let's see if there's a relevant tool in the diagram.
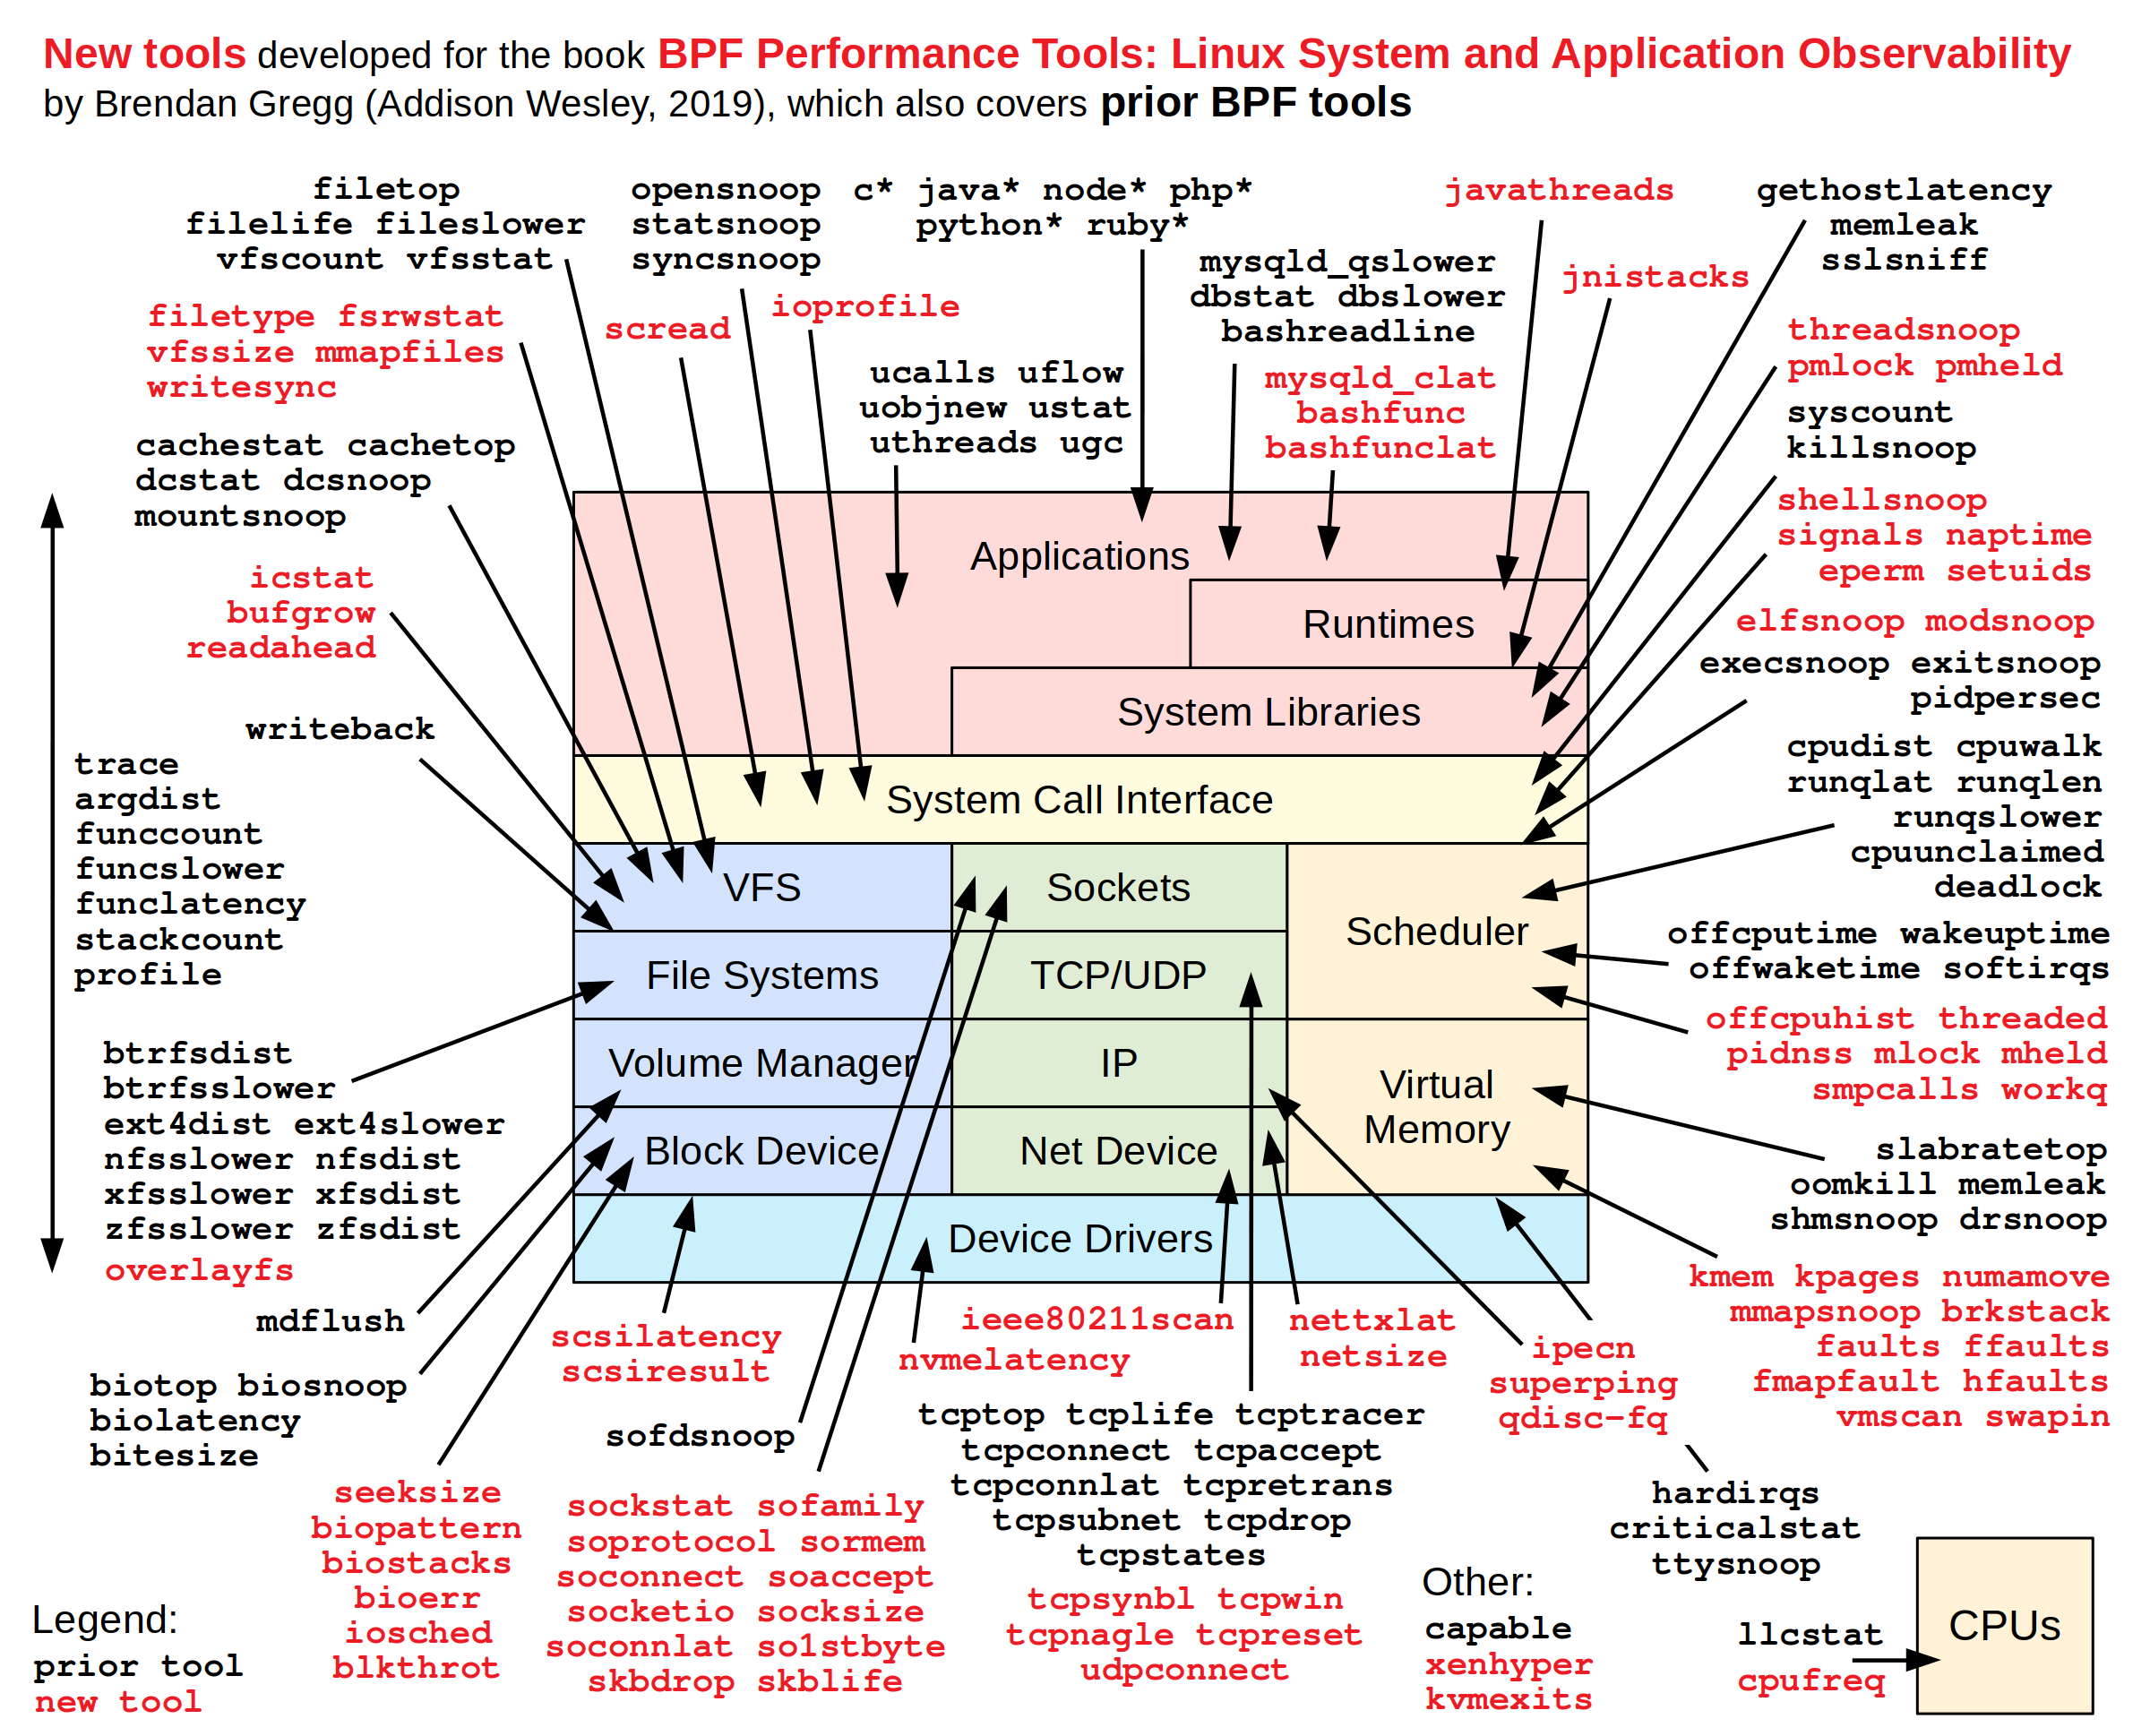
Not much clue here but ioprofile seems relevant. Let's (blindly) try it out:
$ sudo apt install bpftrace  # then, save ioprofile script locally and chmod +x

$ sudo ./ioprofile
Attaching 25 probes...
ERROR: Could not resolve symbol: /proc/self/exe:BEGIN_trigger
Apparently I needed to install bpftrace-dbgsym.
$ sudo ./ioprofile
Attaching 25 probes...
Tracing I/O syscall user stacks. Ctrl-C to end.
Here's a recurring example from ebpf intros:
$ sudo bpftrace -f json -e 'tracepoint:raw_syscalls:sys_enter { @[comm] = count(); } interval:s:5 { print(@); clear(@); }'

{"type": "attached_probes", "data": {"probes": 2}}
{"type": "map", "data": {"@": {"packagekitd": 3, "multipathd": 43, "irqbalance": 44, "bpftrace": 62, "tetragon": 73, "ebpf.summit.202": 245}}}
{"type": "map", "data": {"@": {"sudo": 10, "sshd": 13, "tetragon": 45, "multipathd": 52, "bpftrace": 55, "ebpf.summit.202": 226}}}
{"type": "map", "data": {"@": {"packagekitd": 3, "sudo": 10, "sshd": 13, "multipathd": 44, "irqbalance": 44, "bpftrace": 58, "tetragon": 79, "ebpf.summit.202": 292}}}
{"type": "map", "data": {"@": {"sudo": 10, "sshd": 13, "multipathd": 53, "bpftrace": 56, "ebpf.summit.202": 328, "tetragon": 358}}}
{"type": "map", "data": {"@": {"packagekitd": 3, "sudo": 10, "sshd": 13, "systemd-timesyn": 18, "systemd-network": 18, "systemd-resolve": 18, "multipathd": 43, "irqbalance": 44, "systemd": 47, "bpftrace": 64, "tetragon": 77, "ebpf.summit.202": 316}}}
Ok "ebpf.summit.202" looks interesting. What's that?
$ pgrep -la "ebpf"
The eBPF book has a hint:
You can see the available set of tracing subsystems on your kernel by looking at
/sys/kernel/tracing/available_events, as follows:cat /sys/kernel/tracing/available_events
and another one:
sudo bpftrace -l "*write*"
but I didn't immediately see anything obvious.
A bit more scrolling in the book, and:
Scripts for bpftrace can coordinate multiple eBPF programs attached to different events. For example, consider the
opensnoop.btscript that reports on files being opened.
Let's give it a try:
$ sudo ./opensnoop
./opensnoop:34:9-14: ERROR: Can not access field 'ret' on type '(ctx) struct _tracepoint_syscalls_sys_exit_openat *'. Try dereferencing it first, or using '->'
    $ret = args.ret;
           ~~~~~
Fixed two of these, and then:
$ sudo ./opensnoop
Attaching 6 probes...
Tracing open syscalls... Hit Ctrl-C to end.
PID    COMM               FD ERR PATH
2545   ebpf.summit.202    18   0 /etc/passwd
2545   ebpf.summit.202    18   0 /ebpf.summit
2545   ebpf.summit.202    18   0 /etc/passwd
2545   ebpf.summit.202    18   0 /ebpf.summit
2545   ebpf.summit.202    18   0 /etc/passwd
2545   ebpf.summit.202    18   0 /ebpf.summit
2545   ebpf.summit.202    18   0 /etc/passwd
2545   ebpf.summit.202    18   0 /ebpf.summit
2545   ebpf.summit.202    18   0 /etc/passwd
For some reason, that PID does not show up in ps. Ah well, let's kill it:
$ sudo kill 2545
$ sudo cat /ebpf.summit

You purged the computers of the malware - and not a second too late. Congratulations!
BTW, the opensnoop tool was on the tools diagram,
I just didn't realize what it does!
And now, it's probably a good idea to read up some references I picked up during the summit.
Further reading#
- The "Learning eBPF" book: O'Reilly, isovalent.
- BPF performance tools: gh, diagram, reference guide, cheat sheet.
- The opensnoop tool
- gh:grafana/beyla
- Pixie - eBPF o11y for k8s
- Tetragon - security observability
- List of the linux kernel system calls
- bpftune - sysctl autotuning