eBPF summit 2023 CTF
The eBPF summit held a CTF, which you can download from here.
Here's a record of my attempts.
Now what's in that file?
$ sudo cat /ebpf.summit
I've been in your kernel for [281.819050 seconds]
$ sudo cat /ebpf.summit
I've been in your kernel for [282.820065 seconds]
How is it updated so quickly? Are they constantly writing to that file?
$ ls -l /
total 72
lrwxrwxrwx   1 root    root        7 Aug 28 22:11 bin -> usr/bin
drwxr-xr-x   3 root    root     4096 Aug 28 22:12 boot
drwxr-xr-x  17 root    root     3840 Sep 13 16:25 dev
----------   1 root    root       50 Sep 13 16:30 ebpf.summit
drwxr-xr-x  91 root    root     4096 Sep 13 16:27 etc
What's ----------??
$ stat /ebpf.summit
  File: /ebpf.summit
  Size: 50          Blocks: 8          IO Block: 4096   regular file
Device: 801h/2049d  Inode: 73151       Links: 1
Access: (0000/----------)  Uid: (    0/    root)   Gid: (    0/    root)
Oh ok it's just the result of chmod ugo-rwx. A user can lock itself out of
their own file, but root still has access anyway.
So, are they really writing so frequently or is there some other kind of magic?
Nothing. Nothing.Ok, this is an ebpf ctf, so let's see if there's a relevant tool in the diagram.
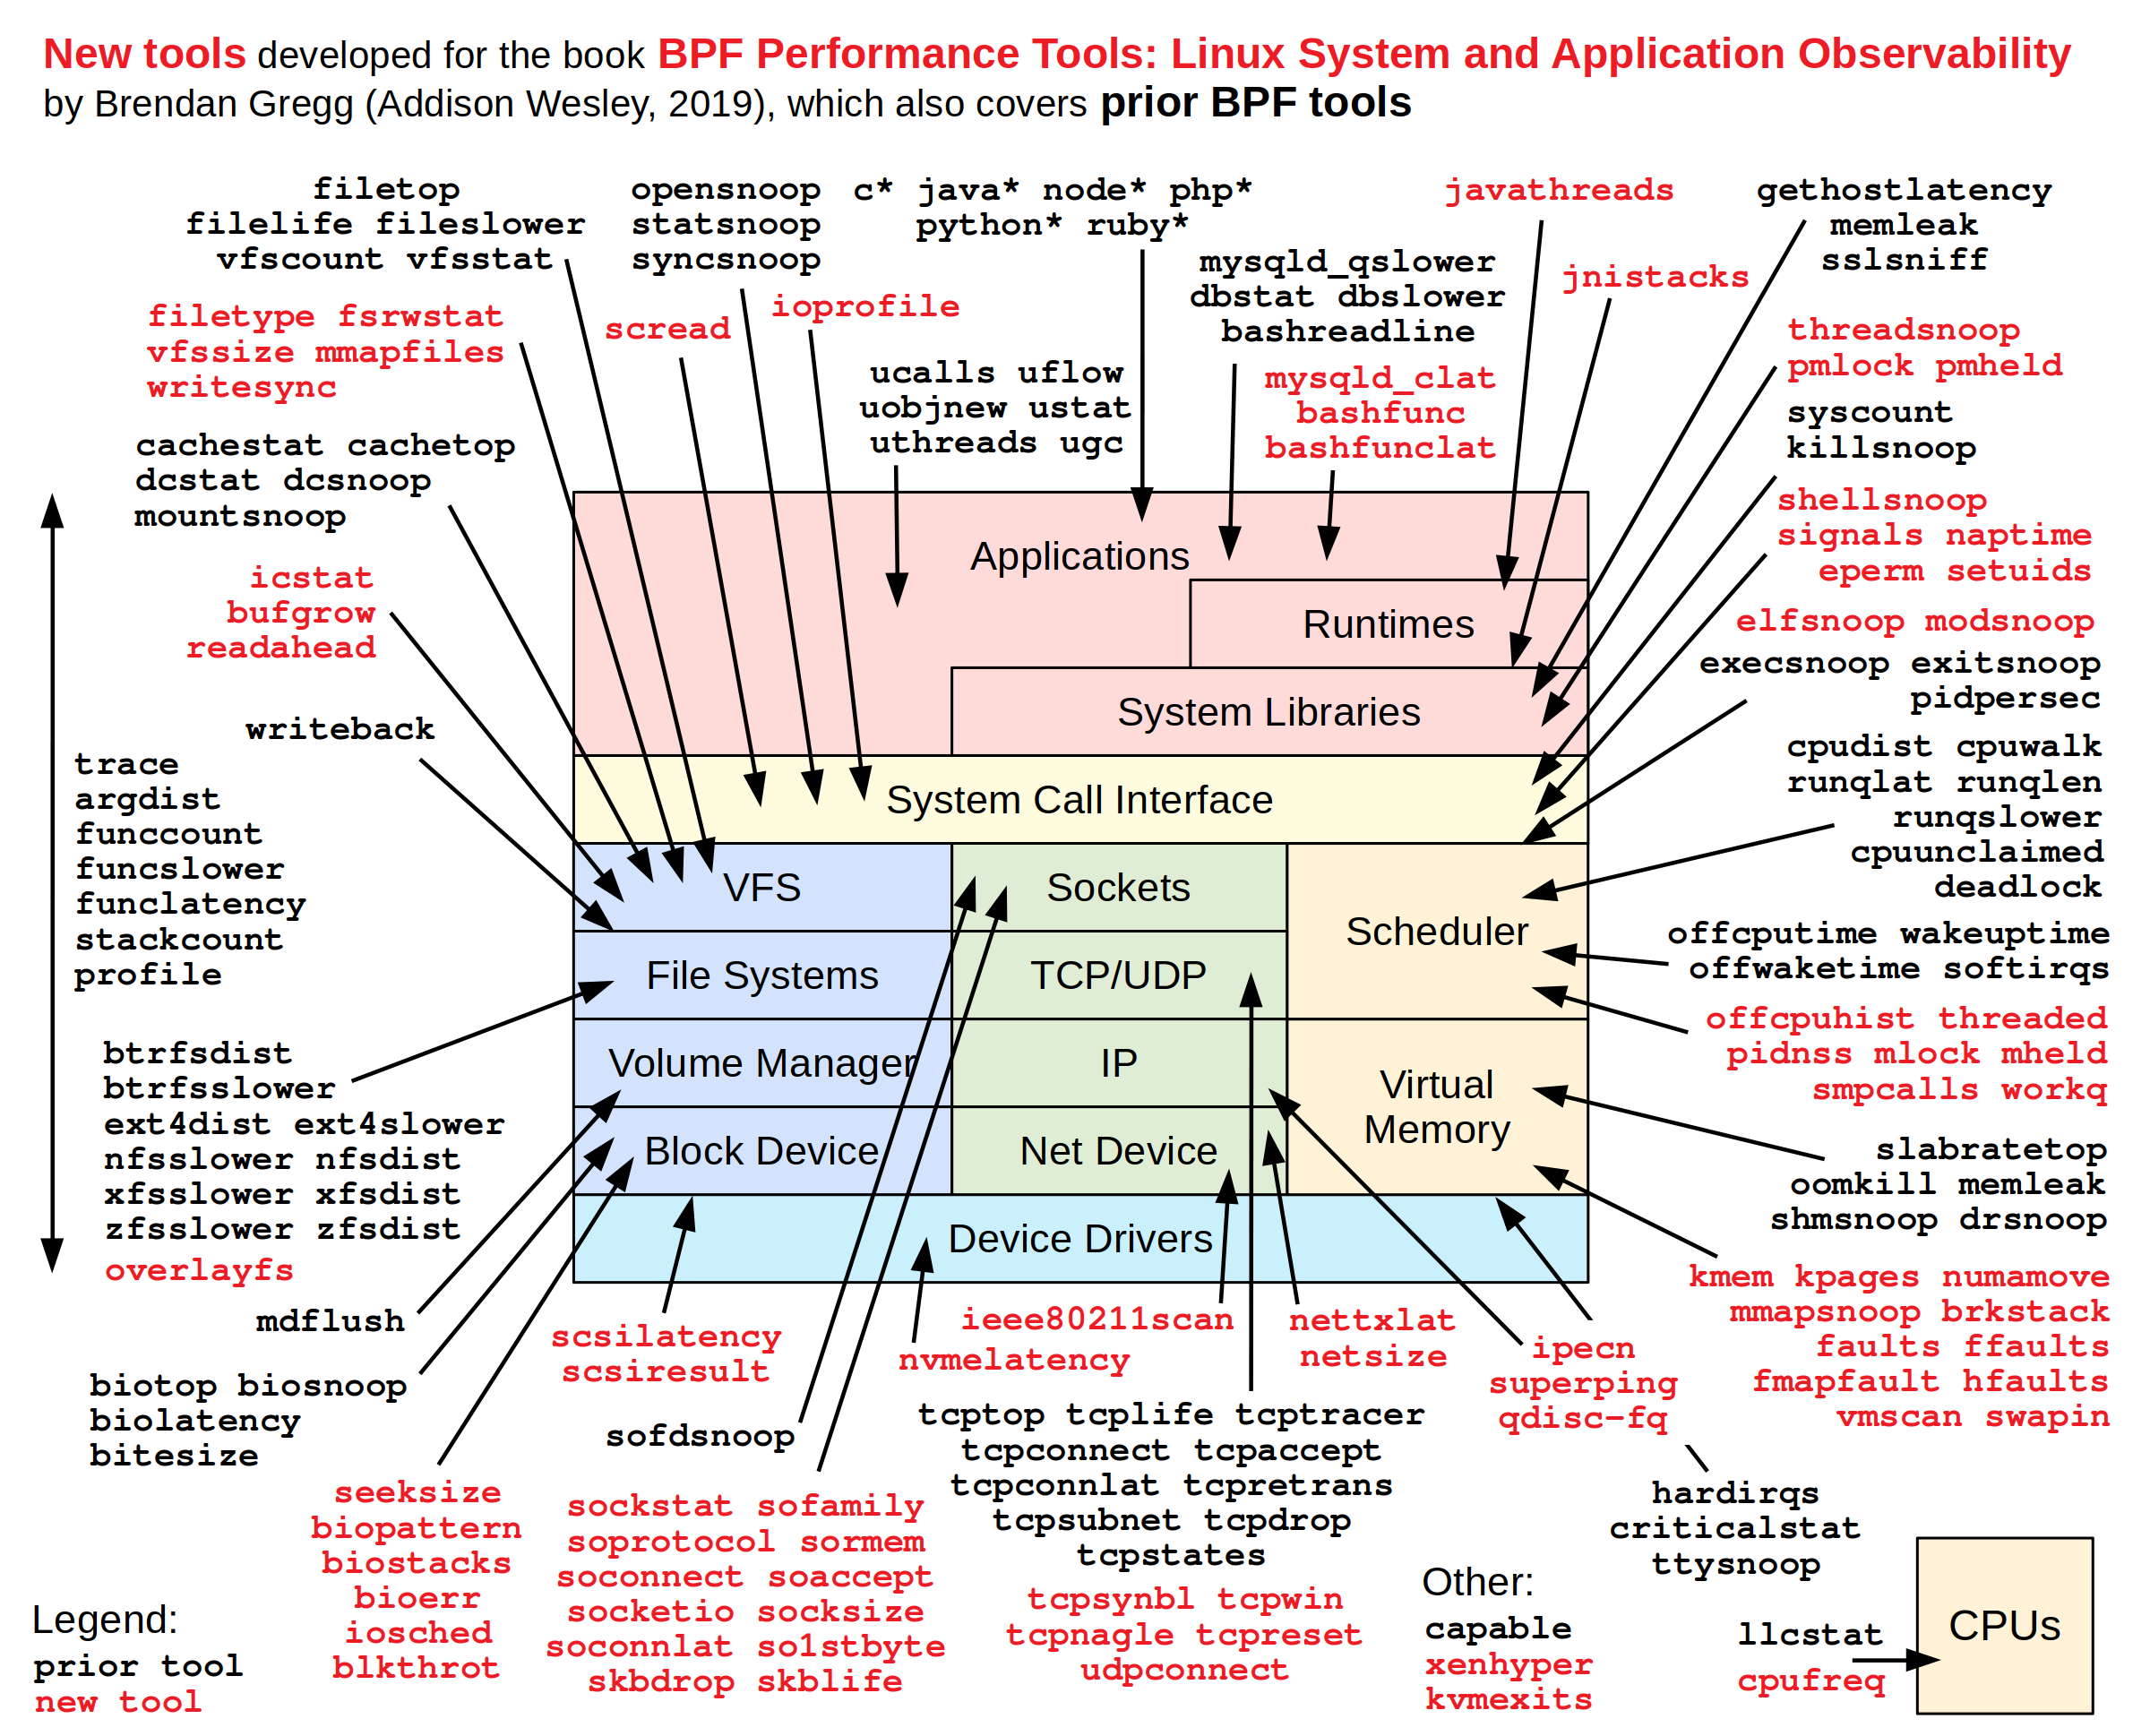
Not much clue here but ioprofile seems relevant. Let's (blindly) try it out:
$ sudo apt install bpftrace  # then, save ioprofile script locally and chmod +x

$ sudo ./ioprofile
Attaching 25 probes...
ERROR: Could not resolve symbol: /proc/self/exe:BEGIN_trigger
Apparently I needed to install bpftrace-dbgsym.
Here's a recurring example from ebpf intros:
$ sudo bpftrace -f json -e 'tracepoint:raw_syscalls:sys_enter { @[comm] = count(); } interval:s:5 { print(@); clear(@); }'

{"type": "attached_probes", "data": {"probes": 2}}
{"type": "map", "data": {"@": {"packagekitd": 3, "multipathd": 43, "irqbalance": 44, "bpftrace": 62, "tetragon": 73, "ebpf.summit.202": 245}}}
{"type": "map", "data": {"@": {"sudo": 10, "sshd": 13, "tetragon": 45, "multipathd": 52, "bpftrace": 55, "ebpf.summit.202": 226}}}
{"type": "map", "data": {"@": {"packagekitd": 3, "sudo": 10, "sshd": 13, "multipathd": 44, "irqbalance": 44, "bpftrace": 58, "tetragon": 79, "ebpf.summit.202": 292}}}
{"type": "map", "data": {"@": {"sudo": 10, "sshd": 13, "multipathd": 53, "bpftrace": 56, "ebpf.summit.202": 328, "tetragon": 358}}}
{"type": "map", "data": {"@": {"packagekitd": 3, "sudo": 10, "sshd": 13, "systemd-timesyn": 18, "systemd-network": 18, "systemd-resolve": 18, "multipathd": 43, "irqbalance": 44, "systemd": 47, "bpftrace": 64, "tetragon": 77, "ebpf.summit.202": 316}}}
Ok "ebpf.summit.202" looks interesting. What's that?
The eBPF book has a hint:
You can see the available set of tracing subsystems on your kernel by looking at
/sys/kernel/tracing/available_events, as follows:cat /sys/kernel/tracing/available_events
and another one:
sudo bpftrace -l "*write*"
but I didn't immediately see anything obvious.
A bit more scrolling in the book, and:
Scripts for bpftrace can coordinate multiple eBPF programs attached to different events. For example, consider the
opensnoop.btscript that reports on files being opened.
Let's give it a try:
$ sudo ./opensnoop
./opensnoop:34:9-14: ERROR: Can not access field 'ret' on type '(ctx) struct _tracepoint_syscalls_sys_exit_openat *'. Try dereferencing it first, or using '->'
    $ret = args.ret;
           ~~~~~
Fixed two of these, and then:
$ sudo ./opensnoop
Attaching 6 probes...
Tracing open syscalls... Hit Ctrl-C to end.
PID    COMM               FD ERR PATH
2545   ebpf.summit.202    18   0 /etc/passwd
2545   ebpf.summit.202    18   0 /ebpf.summit
2545   ebpf.summit.202    18   0 /etc/passwd
2545   ebpf.summit.202    18   0 /ebpf.summit
2545   ebpf.summit.202    18   0 /etc/passwd
2545   ebpf.summit.202    18   0 /ebpf.summit
2545   ebpf.summit.202    18   0 /etc/passwd
2545   ebpf.summit.202    18   0 /ebpf.summit
2545   ebpf.summit.202    18   0 /etc/passwd
For some reason, that PID does not show up in ps. Ah well, let's kill it:
$ sudo kill 2545
$ sudo cat /ebpf.summit

You purged the computers of the malware - and not a second too late. Congratulations!
BTW, the opensnoop tool was on the tools diagram,
I just didn't realize what it does!
And now, it's probably a good idea to read up some references I picked up during the summit.
Further reading
- The "Learning eBPF" book: O'Reilly, isovalent.
- BPF performance tools: gh, diagram, reference guide, cheat sheet.
- The opensnoop tool
- gh:grafana/beyla
- Pixie - eBPF o11y for k8s
- Tetragon - security observability
- List of the linux kernel system calls
- bpftune - sysctl autotuning